

Hill Strategies Releases Report on Diversity of Canadian Artists
/The following is excerpted from a communication issued by Hill Strategies Research.
Demographic Diversity of Artists in Canada, based on the 2016 census, provides insights into the situations of four demographic groups of artists: women, Indigenous people, members of racialized groups, and members of official language minority groups.
A previous report in the Statistical Insights on the Arts series found that there are 158,100 artists in Canada, representing 0.87% of the overall Canadian labour force (also called the concentration of artists). The median income of Canadian artists is $24,300.
Key findings follow regarding each demographic group of artists. Because data related to disability, deafness, and sexual orientation are not available from the census, they could not be analyzed in this report.
Women artists
A higher proportion of Canada’s artists are women (52%) than in the overall labour force (48%). Among women, the concentration of artists (0.94%) is much higher than among men (0.79%).
A higher proportion of women than men artists have a bachelor’s degree or higher (51% vs 42%). Very similar proportions of women and men artists are 45 years of age or older (45% and 47%), Indigenous (3.1% and 3.2%), racialized (15% for both), or immigrants to Canada (21% and 20%). The same proportion of women and men artists are self-employed (52%).
Women and men hold most arts occupations in similar proportions, but there are substantially fewer women producers, directors, and choreographers than men (12% of women artists vs. 23% of men artists) and substantially more women dancers than men (11% vs. 2%).
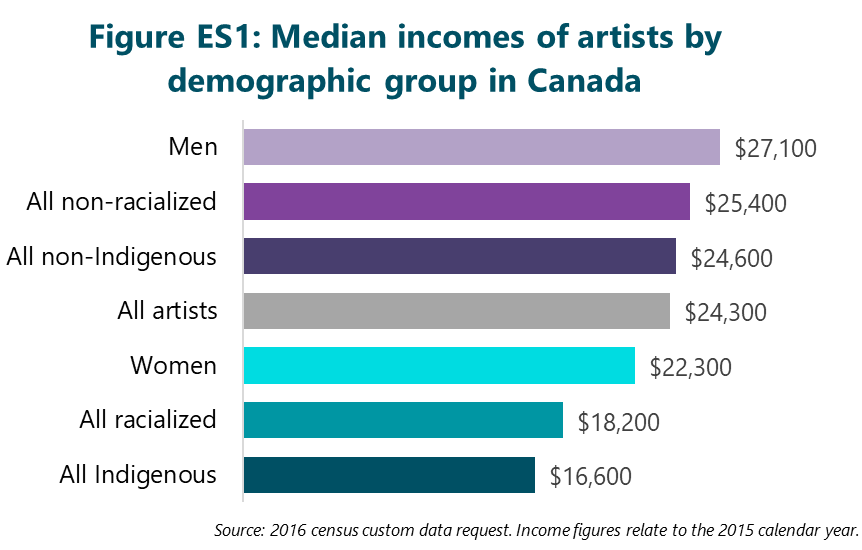
Figure ES1 provides a comparison of median incomes of different groups of artists. For example, women artists have a median income ($22,300) that is well below that of men artists ($27,100).
Expressed differently, this means that women artists make 82 cents of total income for every $1 for men artists. In the overall labour force, women make 78 cents of income for every $1 for men. Table ES1 provides relative income totals for the demographic groups that are the focus of this report.

Women artists have lower median incomes than men in six of the nine arts occupations: authors and writers; visual artists; dancers; artisans and craftspeople; other performers; and conductors, composers, and arrangers. Women and men actors and comedians have nearly equal incomes, while women have slightly higher incomes than men in two arts occupations: musicians and singers as well as producers, directors, and choreographers.
The report includes a brief intersectional analysis of women artists’ incomes:
Indigenous women artists have a median income of $17,800.
Racialized women artists have a median income of $17,900.
Indigenous artists
The 5,000 Indigenous artists in Canada account for 3.1% of all artists in the country, lower than the proportion of Indigenous workers in the overall labour force (3.9%). The concentration of artists is lower among Indigenous people (0.69%) than non-Indigenous people (0.87%).
Very similar proportions of Indigenous and non-Indigenous artists are women (51% and 52%, respectively). However, fewer Indigenous than non-Indigenous artists are 45 or older (41% vs. 46%) or have a bachelor’s degree or higher (28% vs. 47%).
The most common occupations differ considerably between Indigenous and non-Indigenous artists:
Much higher proportions of Indigenous than non-Indigenous artists are artisans and visual artists.
Smaller proportions of Indigenous than non-Indigenous artists are musicians, authors, or producers, directors, and choreographers.
As shown in Figure ES1, Indigenous artists have a median income of $16,600, which is less than one-half of the median income of all Indigenous workers in Canada ($37,200). Non-Indigenous artists have a median income of $24,600, 44% less than all non-Indigenous workers ($43,700).
Indigenous artists make a median income of 68 cents for every $1 for non-Indigenous artists. In the overall labour force, Indigenous workers have a median income of 85 cents for every $1 for non-Indigenous workers.
Indigenous artists have much lower median incomes than non-Indigenous artists in eight of the nine arts occupations. The median incomes of Indigenous artists are less than $14,000 in the two most common occupations: artisans and visual artists.
Racialized artists
There are 23,300 racialized artists in Canada, representing 15% of all artists in the country. This is lower than the proportion of racialized people in the overall labour force (21%). The concentration of artists is lower among racialized people (0.60%) than non-racialized people (0.94%).
A much higher percentage of racialized than non-racialized artists are immigrants (60% vs. 14%). There is a particularly large difference in recent immigration: 42% of racialized artists immigrated to Canada between 1991 and 2016, including 14% who immigrated between 2011 and 2016. In contrast, only 7% of non-racialized artists immigrated to Canada between 1991 and 2016, including 1% who immigrated between 2011 and 2016.
A slightly higher proportion of racialized than non-racialized artists have a bachelor’s degree or higher (50% vs. 46%), but a much smaller proportion are 45 or older (32% vs. 48%). The same proportion of racialized and non-racialized artists are women (52%).
Racialized and non-racialized artists hold many arts occupations in similar proportions.
Figure ES1 shows that racialized artists have a median income of $18,200, about one-half of the median income of all racialized workers in Canada ($35,600). Non-racialized artists have a median income of $25,400, 44% less than all non-racialized workers ($45,700).
Racialized artists make a median income of 72 cents for every $1 for non-racialized artists. In the overall labour force, racialized workers have a median income of 78 cents for every $1 for non-racialized workers.
Racialized artists have lower median incomes than non-racialized artists in eight of the nine arts occupations.
Francophone artists outside Quebec
Based on the language spoken most often at home, the 2,000 French-language artists outside Quebec represent 1.2% of all Canadian artists, while French-minority workers outside Quebec represent 1.8% of all Canadian workers.
The concentration of artists is 0.59% for Francophones outside Quebec, compared with 0.93% for Anglophones outside Quebec.
Women represent a higher proportion of Francophone than Anglophone artists outside Quebec (57% vs. 53%). Similarly, a higher proportion of Francophone than Anglophone artists outside Quebec are Indigenous (4.1% vs. 3.6%).
On the other hand, members of racialized groups represent a lower proportion of Francophone than Anglophone artists outside Quebec (10% vs. 13%), as do immigrants (14% vs. 18%).
Francophone artists outside Quebec have a median income of $27,700, 39% less than all Francophone workers outside Quebec. Anglophone artists outside Quebec have a median income of $24,200, 47% less than all Anglophone workers outside Quebec.
Francophone artists outside Quebec have a median income of $1.15 for every $1 for Anglophone artists outside Quebec. In the overall labour force outside Quebec, Francophone workers have a median income that is essentially equal to that of Anglophones (99 cents for every $1).
Francophone and Anglophone artists outside Quebec hold most arts occupations in similar proportions. However, a higher proportion of Francophone than Anglophone artists outside Quebec are producers, directors, and choreographers (25% of Francophone artists vs. 16% of Anglophone artists), but a smaller proportion are authors and writers (13% vs. 19%).
Francophone artists outside Quebec have higher median incomes than Anglophone artists in six of the eight arts occupations with reliable data.
Anglophone artists in Quebec
The 7,300 English-language artists in Quebec represent 4.6% of all Canadian artists, while all English-language workers in Quebec represent just 2.8% of all Canadian workers.
The concentration of artists is 1.40% among Anglophones in Quebec, compared with 0.78% among Francophones in the province.
Similar proportions of Anglophone and Francophone artists in Quebec are women (47% and 48%). However, higher proportions of Anglophone than Francophone artists in Quebec are Indigenous (2.1% vs. 1.6%), racialized (15% vs. 5%), or immigrants to Canada (23% vs. 10%).
Unlike most demographic and geographic groups, the largest arts occupation among Anglophones in Quebec is authors and writers. Musicians and singers (ranked first among most demographic and geographic groups) are the second-largest occupation among Quebec-based Anglophone artists.
A much higher percentage of Anglophone than Francophone artists in Quebec are authors and writers (24% vs. 13%), but a much lower percentage are producers, directors, and choreographers (16% vs. 26%).
Anglophone artists have a median income of $23,700, 42% less than all Anglophone workers in Quebec. Francophone artists have a median income of $27,800, 34% less than all Francophone workers in Quebec.
Anglophone artists in Quebec make a median income of 85 cents for every $1 for Francophone artists in Quebec. In the overall labour force in Quebec, Anglophones have a median income that is close to that of Francophones (96 cents for every $1).
Anglophone artists in Quebec have lower median incomes than Francophone artists in six of the nine arts occupations.
About this report
After an introduction, subsequent sections of the full report provide detailed information about artists in each of the four key demographic groups. Additional data are provided in an appendix. Full methodological notes can be found in the second appendix.
The report is based on a custom data request from the 2016 long-form census, which classifies most people in the occupation in which they worked the most hours during the census reference week (May 1 to 7, 2016).
Some aspects of the census have particular relevance in capturing the working lives of artists:
Artists who spent more time at another occupation than at their artwork during the reference week would be classified in the other occupation. The census does not capture information about secondary occupations.
Each occupation includes individuals who are employed or self-employed.
Artists who teach in post-secondary, secondary, or elementary schools are classified as professors or teachers, not in artistic occupations. Instructors and teachers in some settings (such as private arts schools, academies, and conservatories) are included as “artists”.
Due to major changes in methods between the 2011 National Household Survey and the 2016 census, data in this report are not comparable to previous reports in the Statistical Insights on the Arts series. Reports based on the 2001 and 2006 long-form census are also not comparable, given a change in the base population used in the calculations of artists.
A subsequent report will examine artists in Canadian municipalities.
[Cut image: National Arts Centre Indigenous Theatre.]